
About me
Hey there! I’m Nidhi Kekatpure, your go-to Business Analyst! 📊✨I help data-driven companies transform their raw data into eye-popping reports and visualizations that aren’t just pretty—they’re powerful! 💡🔍 My mission? To make sure your business decisions are backed by clear insights and automate your reporting so you can spend less time crunching numbers and more time growing your business. 🚀💼I’ve spent hundreds of hours crafting reports that save time ⏳, cut costs 💸, and make life easier for teams like yours. Imagine having all your data seamlessly connected 🔗 and your reports delivered automatically—sounds like a dream, right? Let’s make it a reality! 🌟Ready to take your data game to the next level? Let’s chat! 💬
Skills

Excel | Tableau | Power BI | Power Automate | SQL | Python | AWS | Machine Learning | AI | Chatbot | WebScrapping
Data Visualization - 2+ years
Business Analytics - 3+ years
Team management - 2 year
Report Development - 3+ years
Featured Projects
Python | SQL | Power BI
Vendor Performance
Optimized sales and inventory management using EDA, Predictive, Corelation Analysis, by identifying underperforming brands, enhancing vendor mix, & driving measurable cost savings through bulk purchasing analysis & turnover improvements.

Python | Excel
AB testing

Analyzed 2019 Facebook vs AdWords campaigns using EDA, regression, and hypothesis testing, found Facebook delivered 2×
higher conversions, stronger ROI, and better cost efficiency for budget allocation.
Python | Machine Learning
California Housing Price Prediction
Built and compared ML models (Linear Regression, KNN, Random Forest, Gradient Boosting, Neural Networks) on California housing data, identifying key income/location factors and achieving lowest RMSE with Gradient Boosting.

Python | SQL | Chatbot
AI Inventory Management Chatbot

Developed a AI-powered Flask-based chatbot with GPT-3.5, MySQL integration, Gradio, Huggingface and ML forecasting (item/category-level regression), enabling interactive inventory queries, sales predictions, and data-driven decision-making.
Python | AWS
Subscription Customer Churn Prediction with AWS
Built an end-to-end churn prediction pipeline on AWS (S3, SageMaker, IAM) using XGBoost, achieving ~85 percent accuracy and delivering customer risk segmentation to support retention and revenue protection.

Python | Excel
Web Scraping: Largest U.S. Companies by Revenue

Automated extraction of the top 100 U.S. companies by revenue from Wikipedia using Python, BeautifulSoup, and Requests. The project scrapes, cleans, and stores company data into a structured CSV file for quick analysis—eliminating manual effort and ensuring data accuracy for business insights.
Python | Machine Learning
Stock Analysis Forecasting
Developed a Streamlit-based application for stock analysis, price prediction, and financial modeling — enabling traders and investors to make data-driven decisions through technical analysis, predictive modeling, and risk assessment.

Education

California State University - East Bay | Issued 2024
Master of Science - MS Degree, Engineering Management
Grade: 3.9 GPA

San José State University | Issued 2023
Master's degree, Engineering Management
Grade: 4 GPA

Dr. D. Y. Patil Institute | Issued 2016
Bachelor of Engineering - BE, Computer Engineering
Vendor Performance
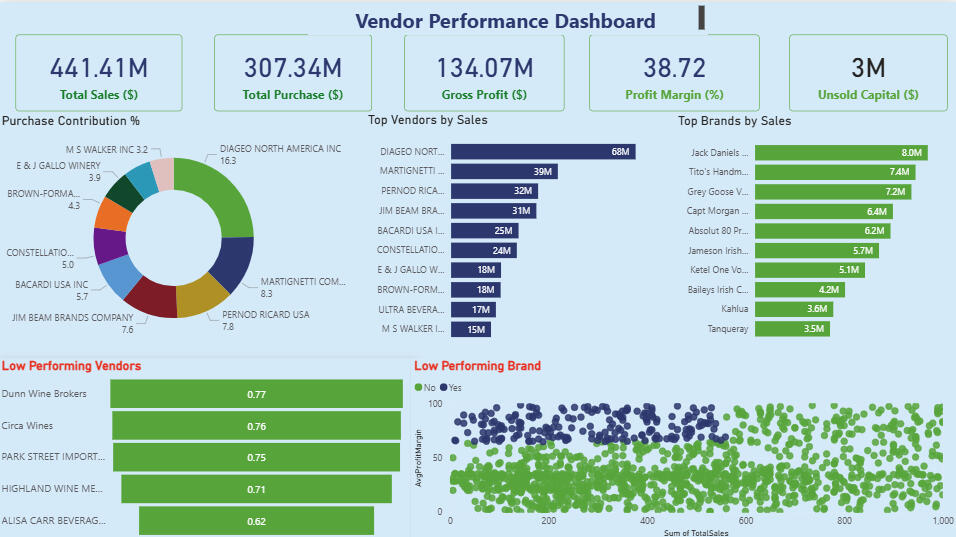
Objective:
To analyze vendor and brand performance in order to improve sales, profitability, and inventory efficiency within retail and wholesale operations.Dataset:
Vendor, product, purchase, and sales transaction data including fields such as purchase price, sales price, quantity, freight cost, gross profit, and profit margin.Approach:
-Conducted exploratory data analysis (EDA) to detect outliers, negative margins, and inventory inefficiencies.
-Filtered invalid or loss-making transactions to ensure reliable insights.
-Used correlation analysis to examine relationships between pricing, sales volume, and profit.
-Segmented vendors into top-performing and low-performing groups for comparison.
-Applied statistical testing to validate differences in profit margins and operational models.
-Designed an interactive Power BI dashboard for visual performance monitoring.Key Findings:
-Top 10 vendors contribute ~66% of total purchases, highlighting dependency risk.
-Bulk purchases reduce unit costs by 72%, improving overall profitability.
-Slow-moving inventory ties up $2.71M in capital, indicating overstock issues.
-Low-performing vendors have higher margins but lower sales, showing pricing inefficiencies.Outcome:
Provided data-driven recommendations to optimize pricing, reduce inventory costs, diversify vendor base, and enhance marketing for underperforming brands—leading to more efficient and profitable operations.Live Demo:
👉 Click here to try app
💻 Github Code
AB Testing
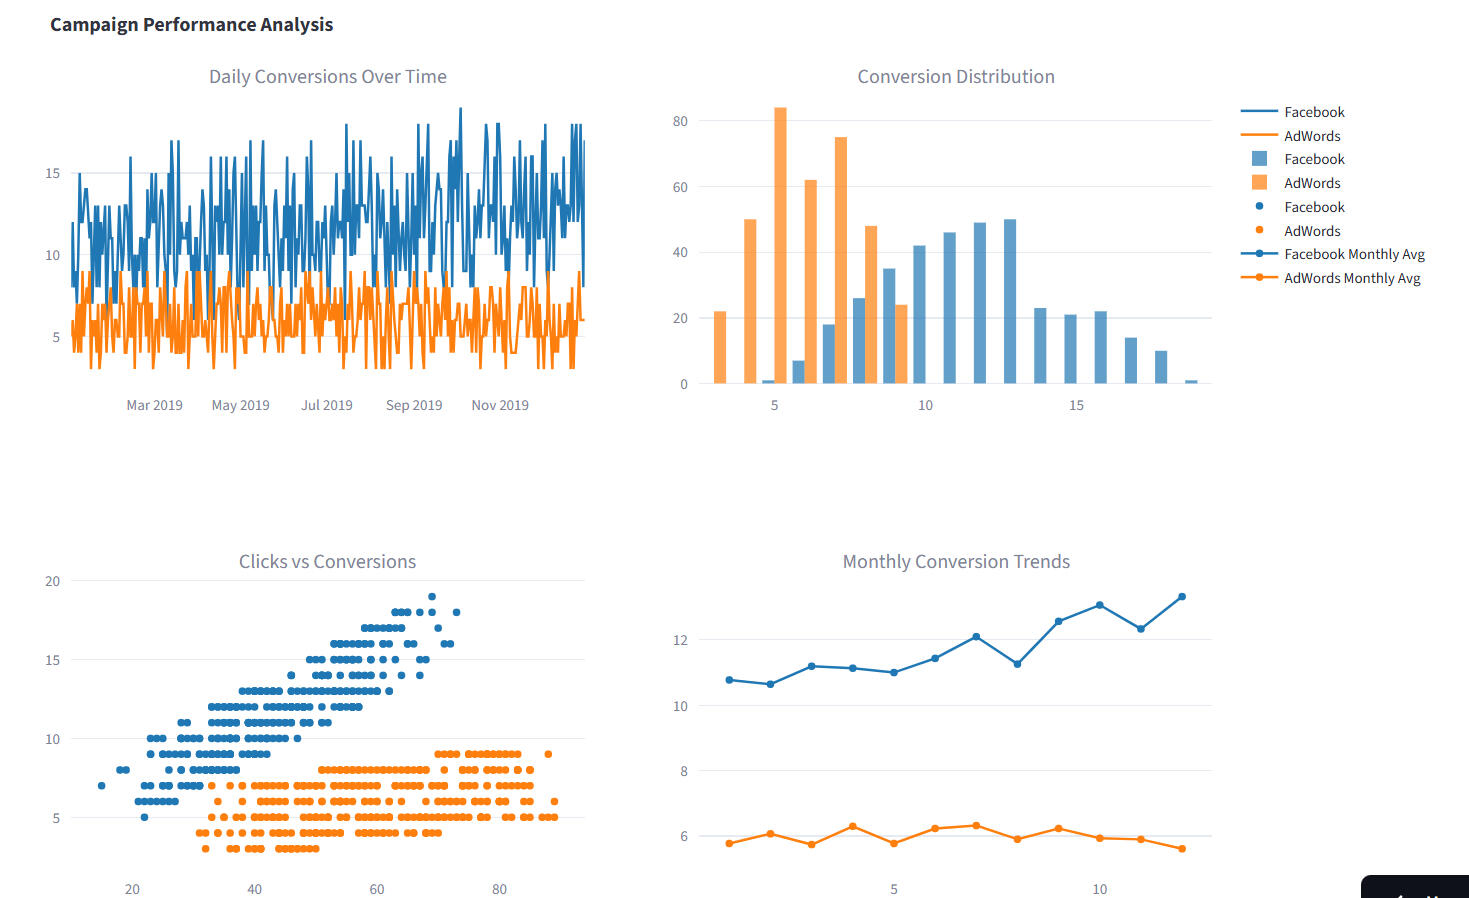
Facebook vs AdWords Ad Campaign AnalysisObjective:
Identify which ad platform (Facebook vs AdWords) delivers higher conversions, clicks, and ROI for 2019 campaigns.Dataset:
365 days (Jan–Dec 2019) across both platforms with features: Views, Clicks, Conversions, CPC, CTR, Cost, Conversion Rate.Tools:
Python (pandas, seaborn, matplotlib, sklearn, statsmodels, scipy)Analysis Performed:
-EDA: Trends, histograms, category comparison
-Correlation: Facebook (0.87) > AdWords (0.45)
-Hypothesis Test: Facebook conversions significantly higher (p ≈ 0)
-Regression: Facebook R² = 0.76 → strong click-conversion prediction
-Cost Analysis: Facebook cheaper CPC in May & Nov; long-term cost-conversion equilibriumKey Insights:-Facebook ≈ 11.7 vs AdWords ≈ 6 conversions/day
-Stronger ROI & cost-efficiency on Facebook
-Peak conversions on Mondays & Tuesdays
-Budget strategy: prioritize Facebook, esp. May & NovFuture Scope:
Integrate ROI dashboard (Power BI / Streamlit) and add A/B testing with multi-channel attribution.Live Demo:
👉 Click here to try app
💻 Github Code
California Housing Price Prediction
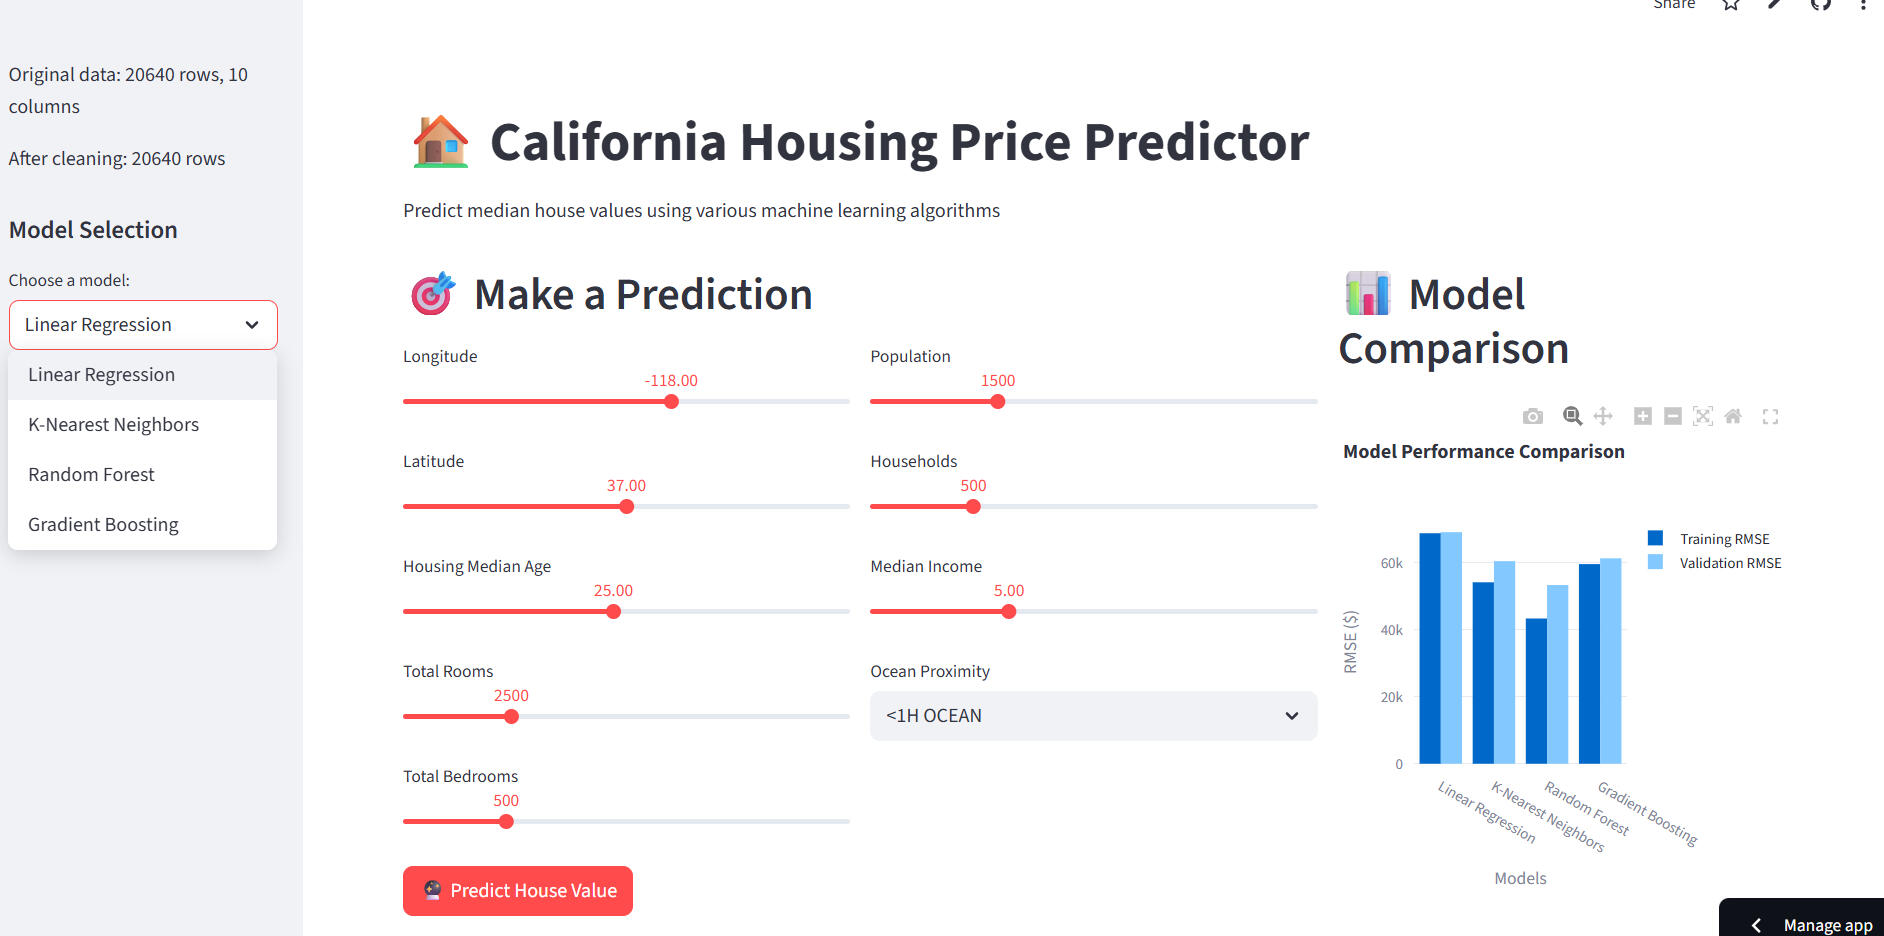
Objective:
Predict median house values across California using multiple regression algorithms and identify key factors influencing housing prices.Overview:
Analyzed the California Housing dataset to uncover drivers of housing prices such as income, proximity to ocean, and population. Compared Linear Regression, KNN, Random Forest, Gradient Boosting, and Neural Networks using RMSE to determine the most accurate model.Dataset Highlights:-Source: housing.csv
-Features: 8 numerical + 1 categorical (oceanproximity)
-Preprocessing: dummy encoding, null handling, scaling, and train–test split
-Target: medianhouse_valueKey Insights:-Median income shows strong positive correlation with house prices
-Coastal regions have higher median values
-Gradient Boosting achieved the lowest RMSE, outperforming other modelsModels Used:
Linear Regression | KNN | Random Forest | Gradient Boosting | Neural NetworksTools & Libraries:
Python, pandas, NumPy, scikit-learn, TensorFlow/Keras, seaborn, matplotlibLive Demo:
👉 Click here to try app
💻 Github Code
AI Inventory Management Chatbot
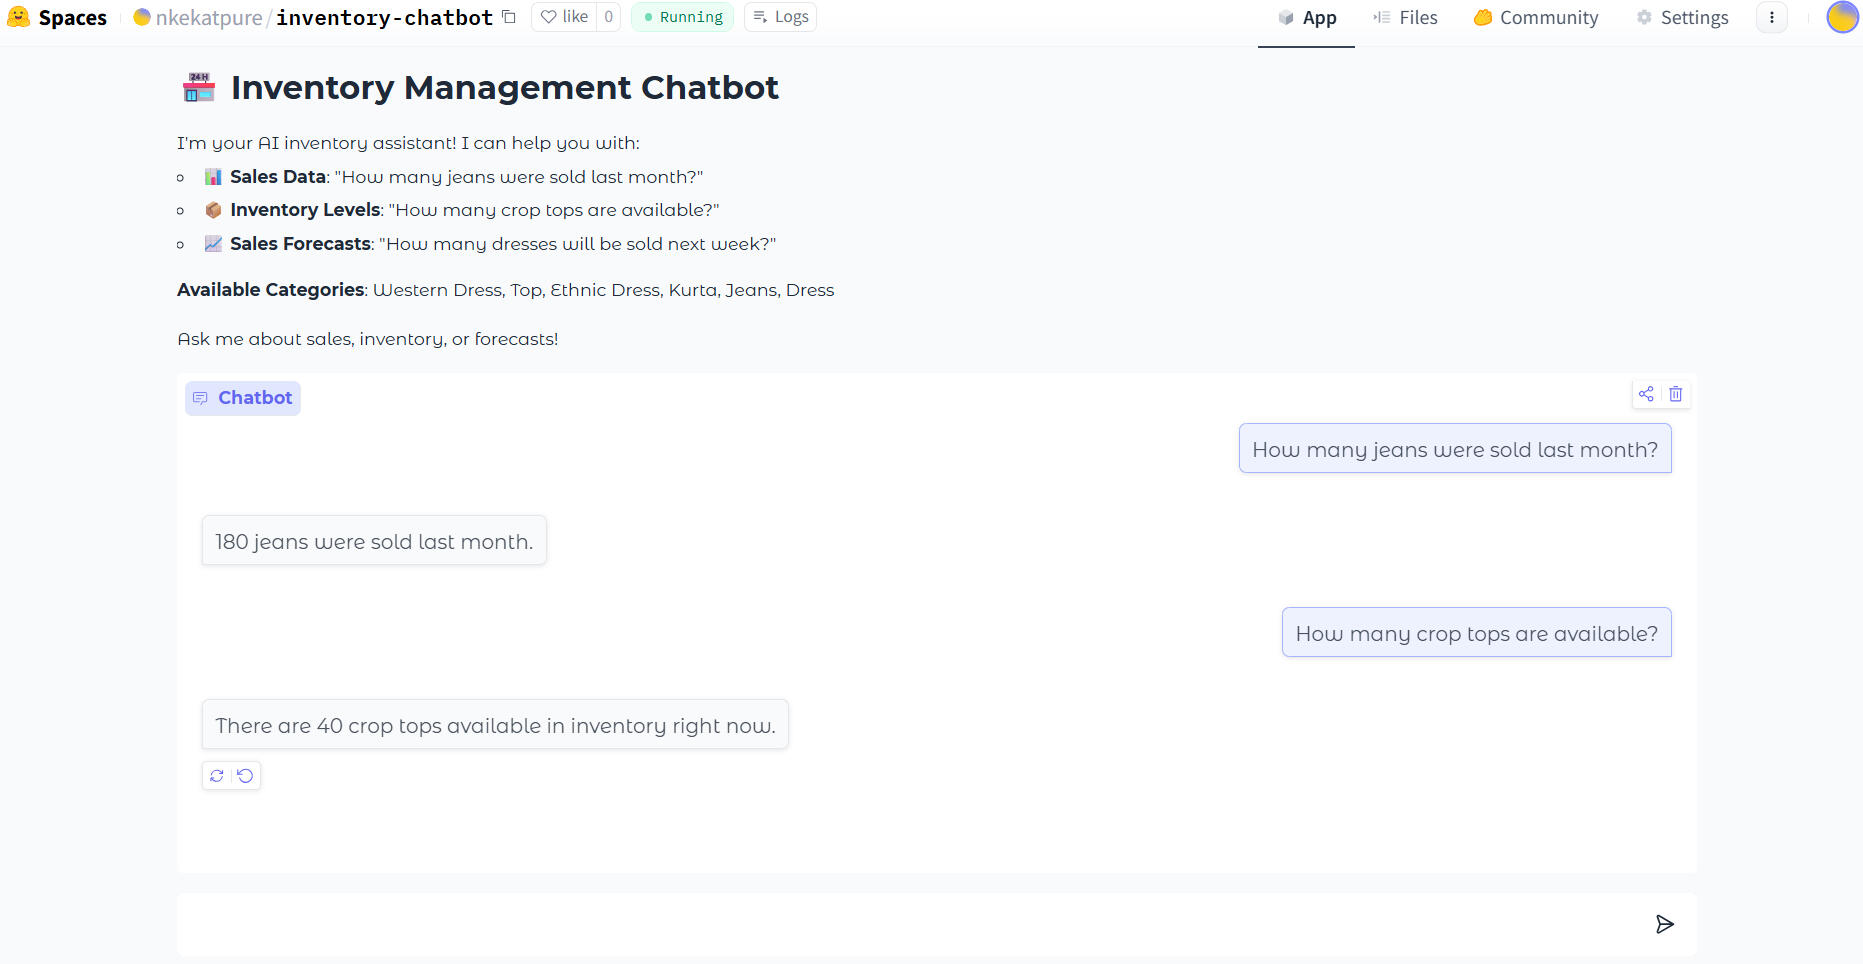
🤖AI Inventory Management ChatbotOverview:
Developed a Flask-based AI chatbot powered by OpenAI GPT-3.5 Turbo and Linear Regression forecasting models to enable real-time inventory, sales, and forecasting insights through conversational interaction.Key Features:Conversational Analytics: Chatbot interface for querying inventory, sales forecasts, and category-level trends.
Forecasting Engine: Integrated item- and category-level Linear Regression models trained with historical sales data to predict upcoming demand.
Data Pipeline: Automated preprocessing, moving averages (3–30 days), and data standardization for consistent trend analysis.
Database Integration: Real-time MySQL connectivity for fetching and updating inventory metrics.
Predictive Insights: Combines ML forecasting and GPT responses for dynamic, human-like decision support.
Scalable Design: Modular structure (app.py, forecast.py, dbConnector.py, readData.py) enabling easy updates and extension.Tech Stack:
Python · Flask · GPT-3.5 Turbo · scikit-learn · MySQL · HTML/CSS · Hugging Face SpacesLive Demo:
👉 Click here to try app
💻 Github Code
Subscription Customer Churn Prediction with AWS
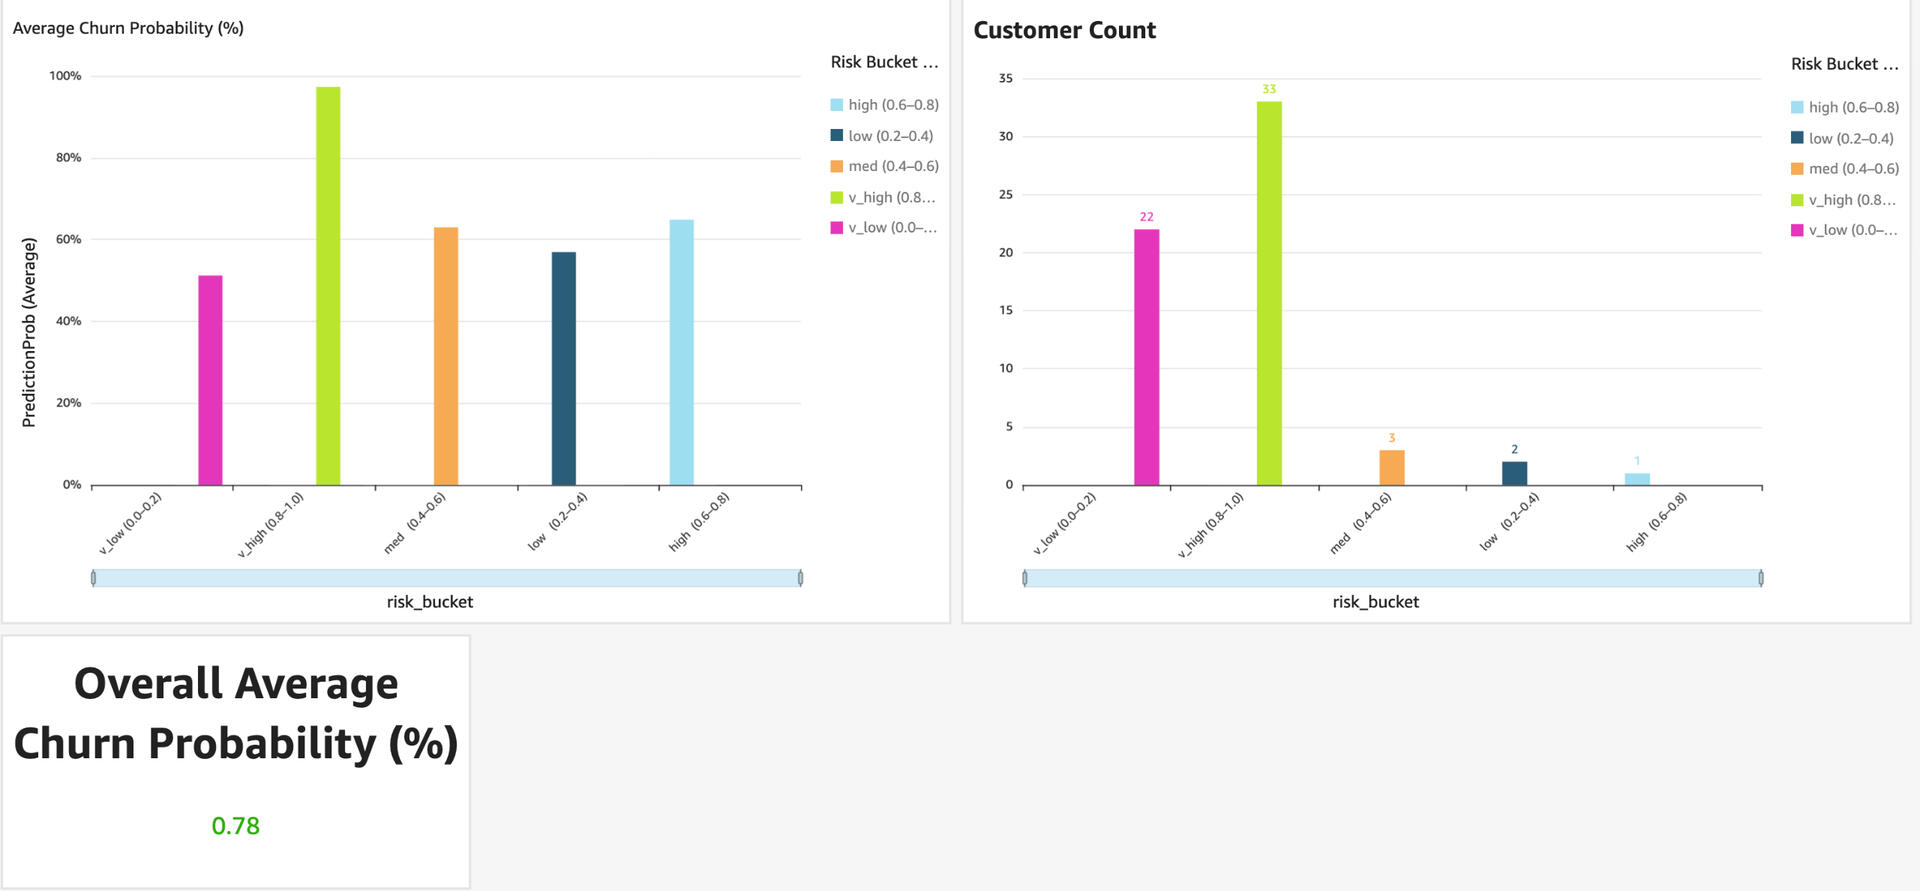
☁️ Customer Churn Prediction with AWSOverview:
Developed an end-to-end ML pipeline on AWS to predict subscription customer churn and identify high-risk users, enabling data-driven retention and revenue protection strategies.Architecture:
CSV Data → S3 → SageMaker (Training & Deployment) → Model Endpoint → Predictions → QuickSight DashboardsAWS Services Used:
Amazon S3 · SageMaker · IAM · Lambda (optional) · QuickSightDataset:
12 features including demographics, financials, and service details.
Target: Churn (0 = retained, 1 = churned)Model & Performance:-Algorithm: XGBoost
-AUC: 0.85–0.90 · Accuracy: ~83%
-Top Predictors: Tenure months, contract type, monthly charges, support callsKey Insights:-Month-to-month contracts → 3× higher churn
-3 support calls → 2× higher churn
-Electronic payments linked to higher churn riskBusiness Impact:-Segmented customers into High / Medium / Low churn risk
-Enabled targeted retention and marketing campaigns
-Supported real-time predictions via SageMaker endpointsTech Stack:
Python · AWS S3 · SageMaker · Lambda · QuickSight · XGBoost · Pandas · Scikit-learnLive Demo:
👉 Click here to try app
💻 Github Code
Web Scraping – Largest U.S. Companies by Revenue
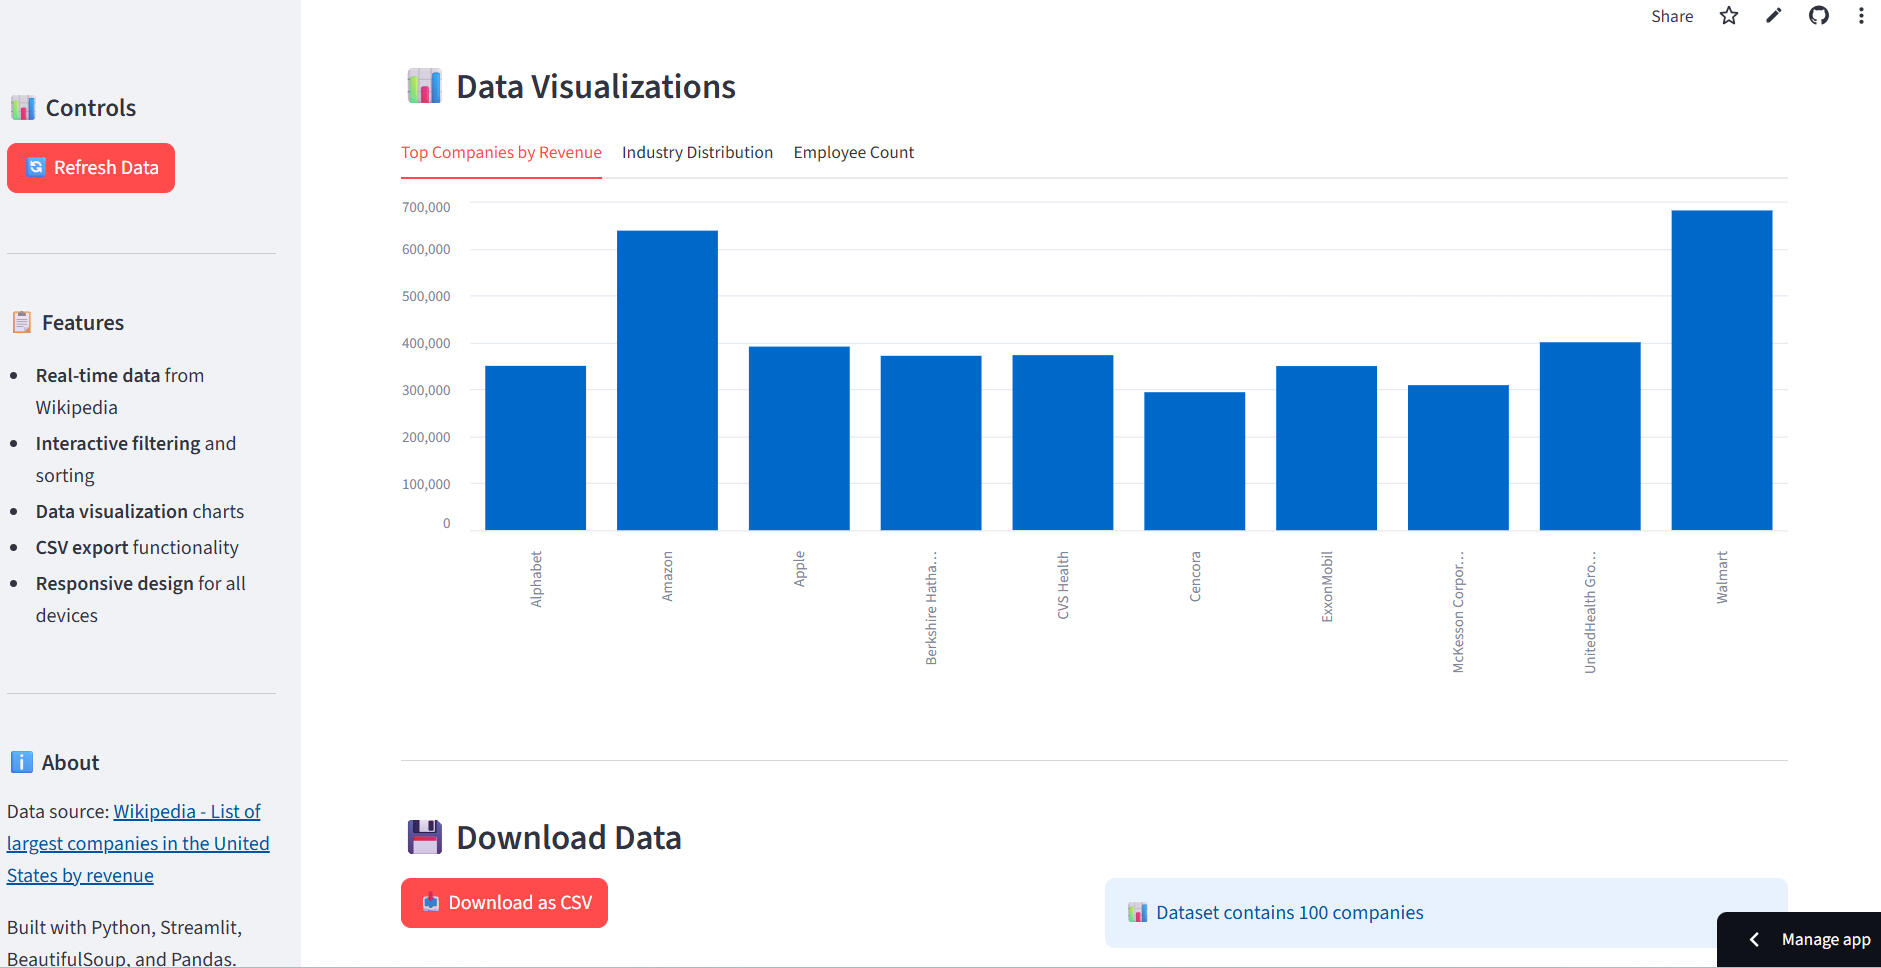
🕸️ Web Scraping – Largest U.S. Companies by RevenueOverview:
Built a Python web scraper using BeautifulSoup, Requests, and pandas to automatically extract the Top 100 U.S. companies by revenue from Wikipedia. The data includes company name, industry, revenue, growth %, employees, and headquarters.Solution Highlights:
-Automated webpage fetching and HTML parsing
-Extracted and cleaned key company metrics
-Exported structured data into a CSV file for analytics and BI integrationTech Stack:
Python · BeautifulSoup · Requests · pandasLive Demo:
👉 Click here to try app
💻 Github Code
Stock Analysis Forecasting
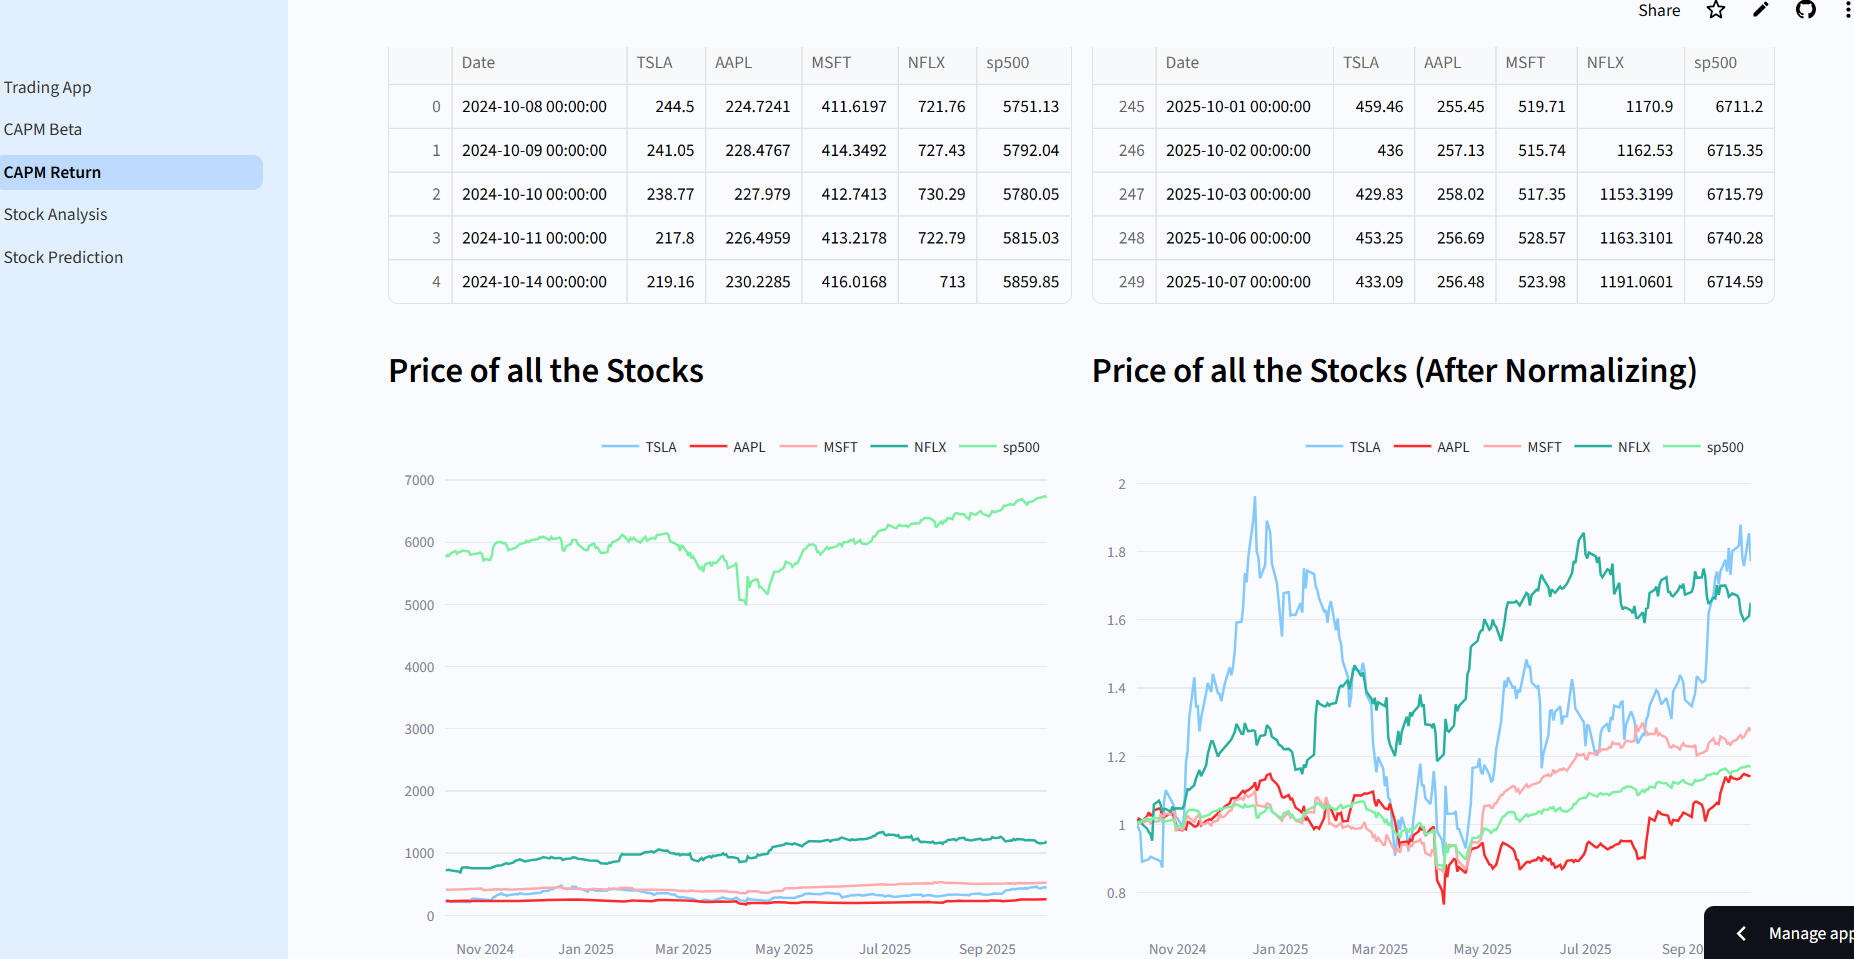
💹 Trading Guide AppOverview:
Developed a Streamlit application for stock analysis, price prediction, and financial modeling, enabling traders and investors to make data-driven decisions using technical indicators, ARIMA forecasting, and CAPM risk analysis.Key Features:Stock Analysis: Real-time financial metrics, RSI, MACD, moving averages, and interactive candlestick charts.
Price Prediction: 30-day ARIMA-based forecasting with RMSE evaluation and visual predictions.
CAPM Analysis: Multi-stock beta calculation, portfolio risk assessment, and expected return visualization.
Technical Stack: Python · Streamlit · yfinance · Plotly · scikit-learn · statsmodels · pandasDeployment:
Built for Streamlit Cloud, fully interactive and ready for real-time financial exploration.Live Demo:
👉 Click here to try app
💻 Github Code